Annotation Project Tutorial (3D)
This tutorial will guide you through the steps to create a 3D annotation project. Follow the instructions carefully to set up your project successfully.
Step 1: Dataset Selection
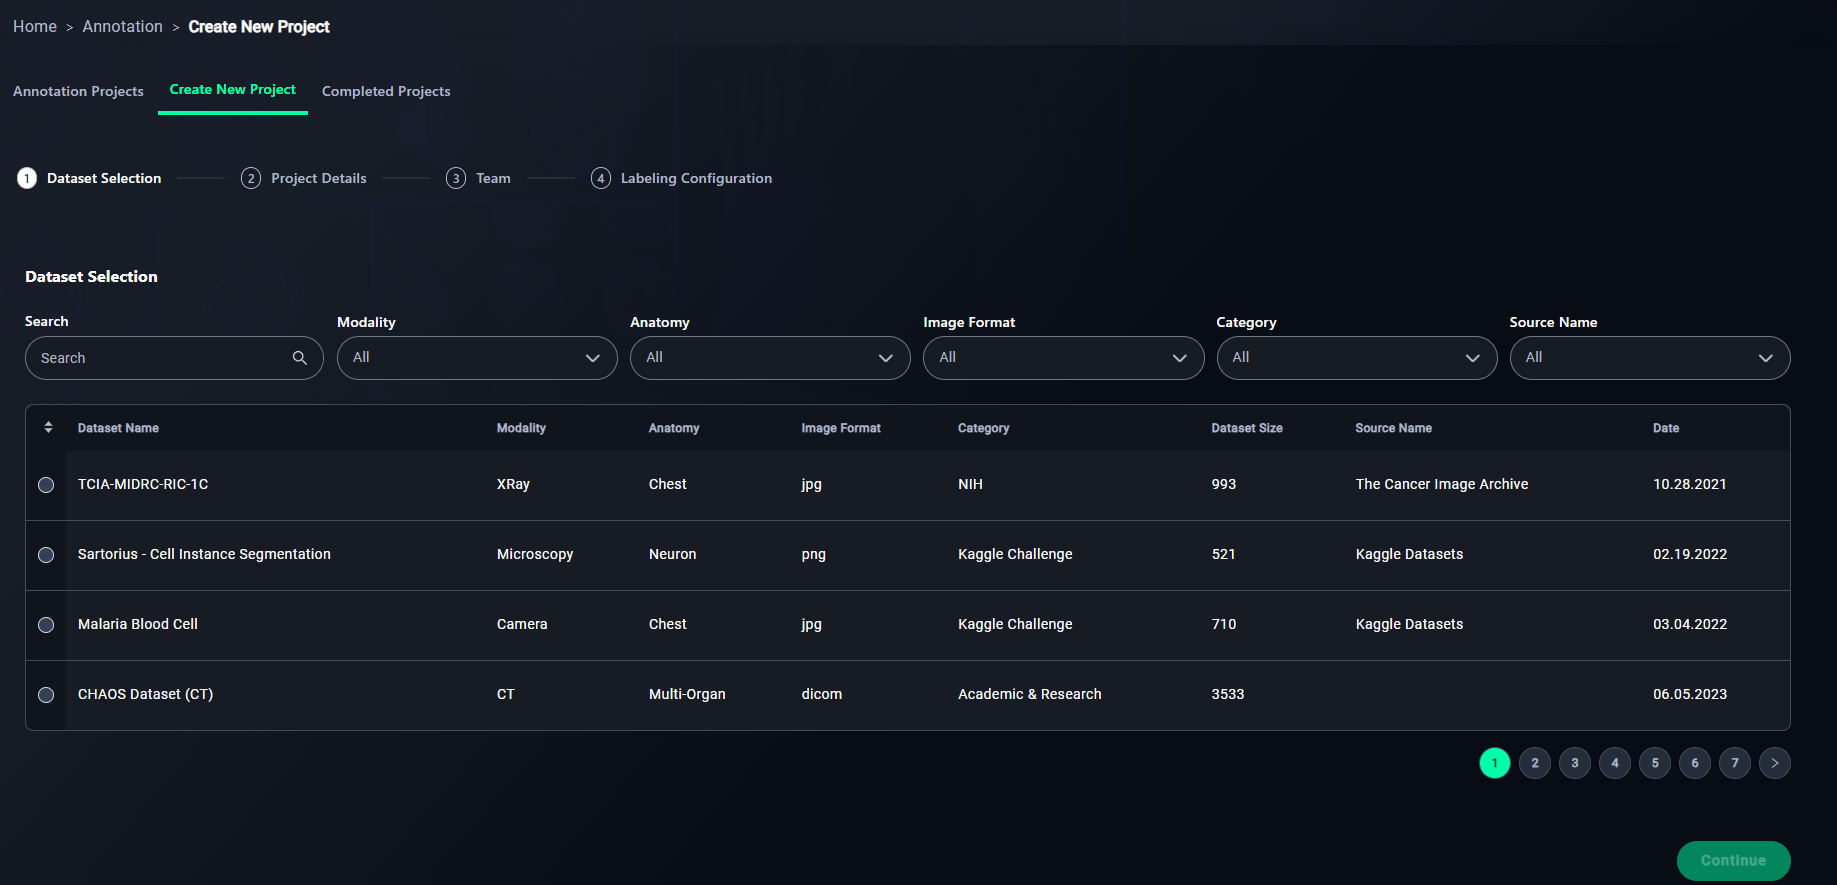
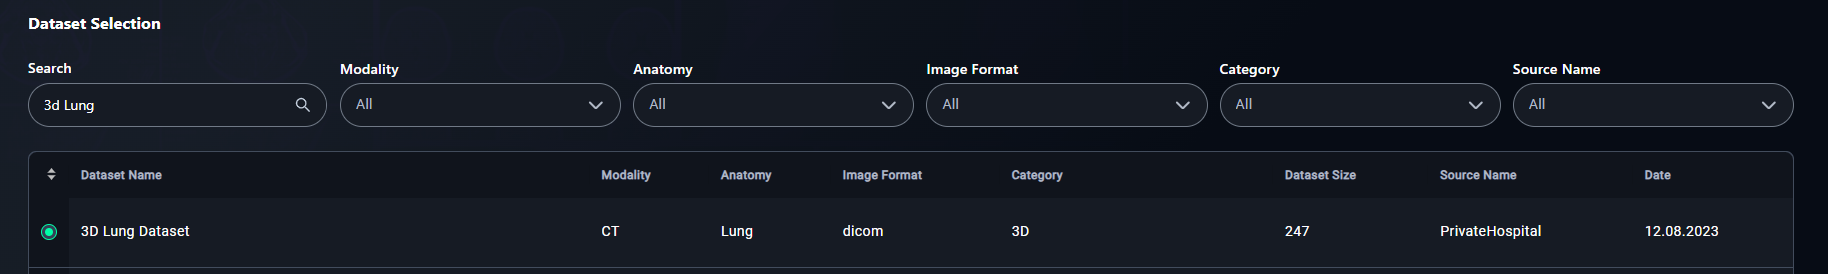
1. Search
- Use the search bar to locate your dataset by name.
- Type "3D Lung" in the search bar to find the 3D Lung Dataset dataset.
2. Apply Filters
- Refine your search using filters:
- Select filters such as:
- Modality: Choose the data type (e.g., XRay, CT).
- Anatomy: Filter by regions like Chest or Neuron.
- Image Format: Select JPG, PNG, or DICOM.
- Category: Choose the source (e.g., NIH).
- Source Name: Specify the source name (e.g., "The Cancer Image Archive").
- Select filters such as:
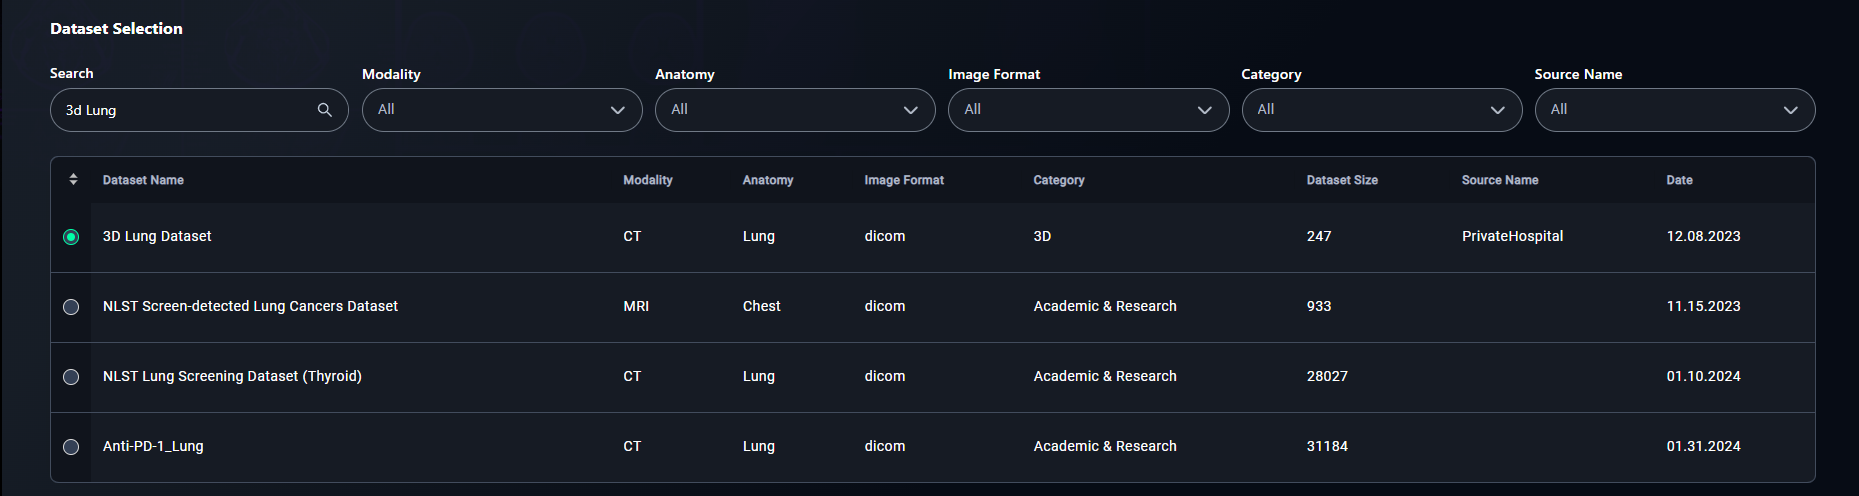
3. Select a Dataset
- Click the radio button for your chosen dataset.
- Example: Select 3D Lung Dataset.
5. Proceed
- Click Continue to move to the next step: Project Details.
Step 2: Project Details
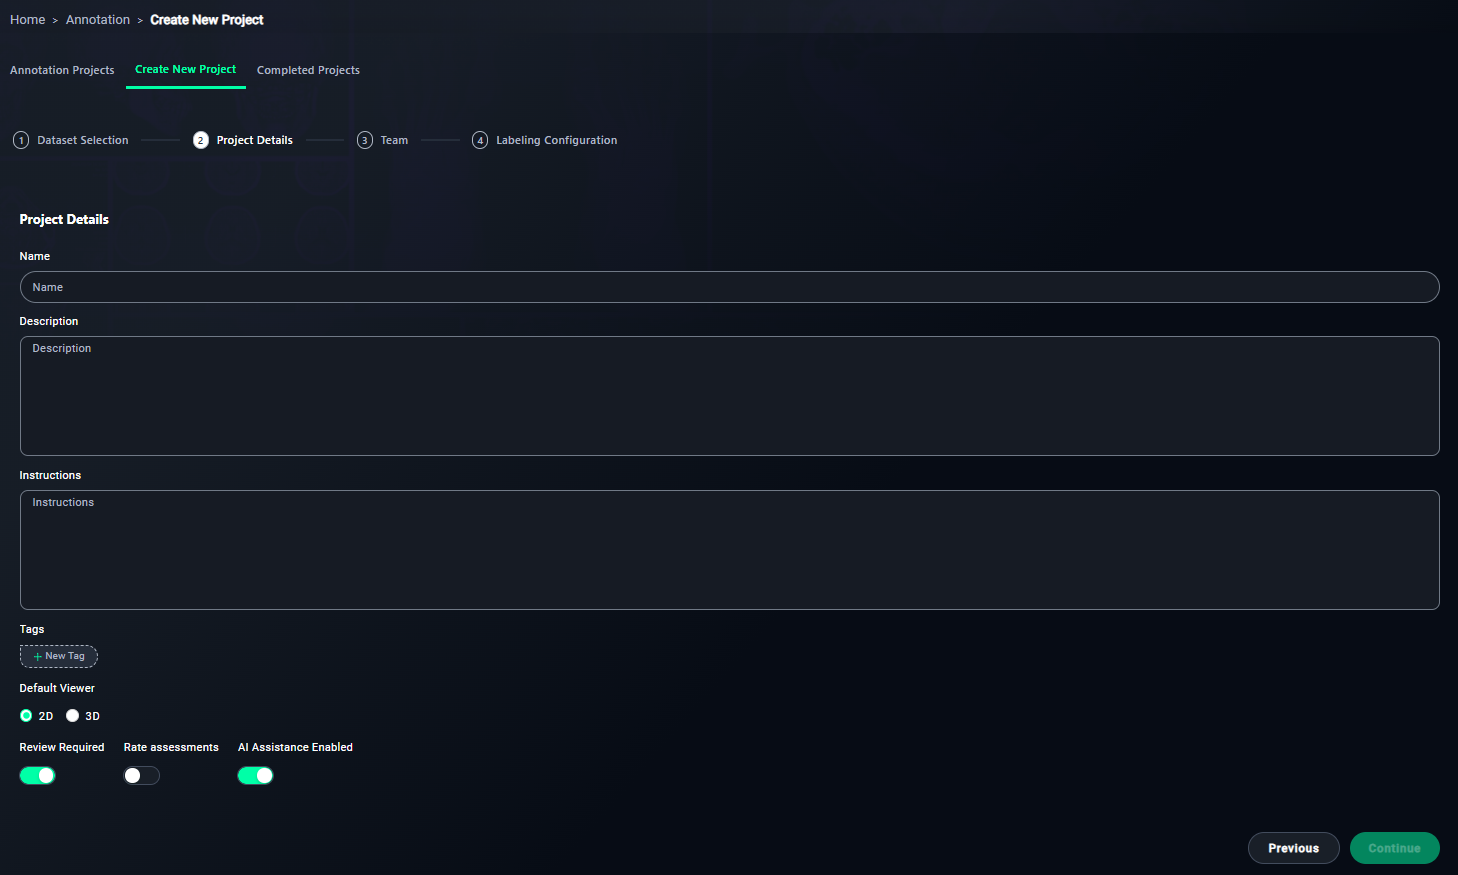
1. Name Your Project
- Enter a meaningful name for your project.
- Type
3D Lung Annotation Project.
- Type

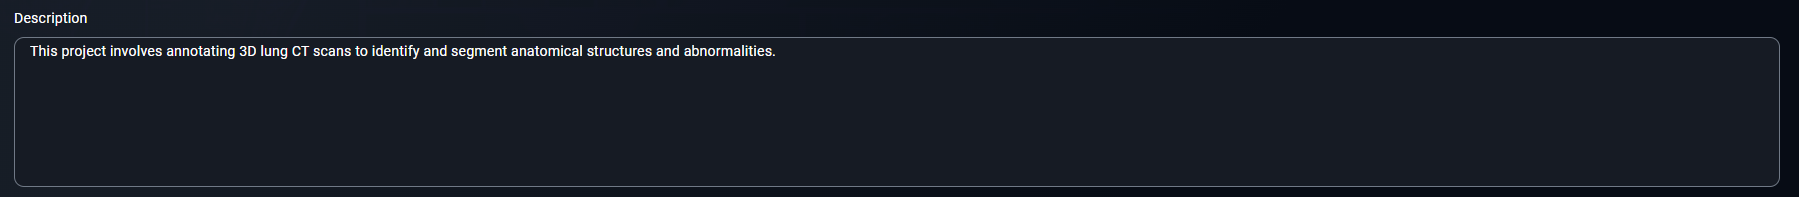
2. Write a Description
- Provide an overview of the project's objective.
- Write a description like:
This project involves annotating 3D lung CT scans to identify and segment anatomical structures and abnormalities.
- Write a description like:
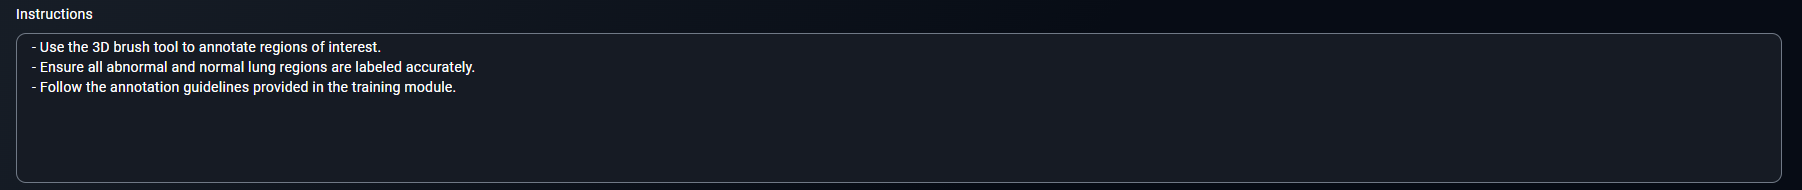
3. Provide Annotator Instructions
- Write step-by-step instructions for annotators.
- Include points such as:
- Use the 3D brush tool to annotate regions of interest.
- Ensure all abnormal and normal lung regions are labeled accurately.
- Follow the annotation guidelines provided in the training module.
- Include points such as:
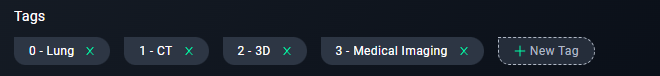
4. Add Tags
- Use tags to categorize the project.
- Add tags like
Lung, CT, 3D, Medical Imaging.
- Add tags like
5. Configure Viewer Settings
-
Ensure the 3D Viewer option is selected.

6. Enable Review Requirements
- Keep this enabled to ensure all annotations are reviewed.
7. Optional: Rate Assessments
- Enable this if annotators need to rate task difficulty.
8. Enable AI Assistance
- Turn this on if you want AI to assist in annotations.

9. Proceed
- Click Continue to move to the next step: Team.
Step 3: Team
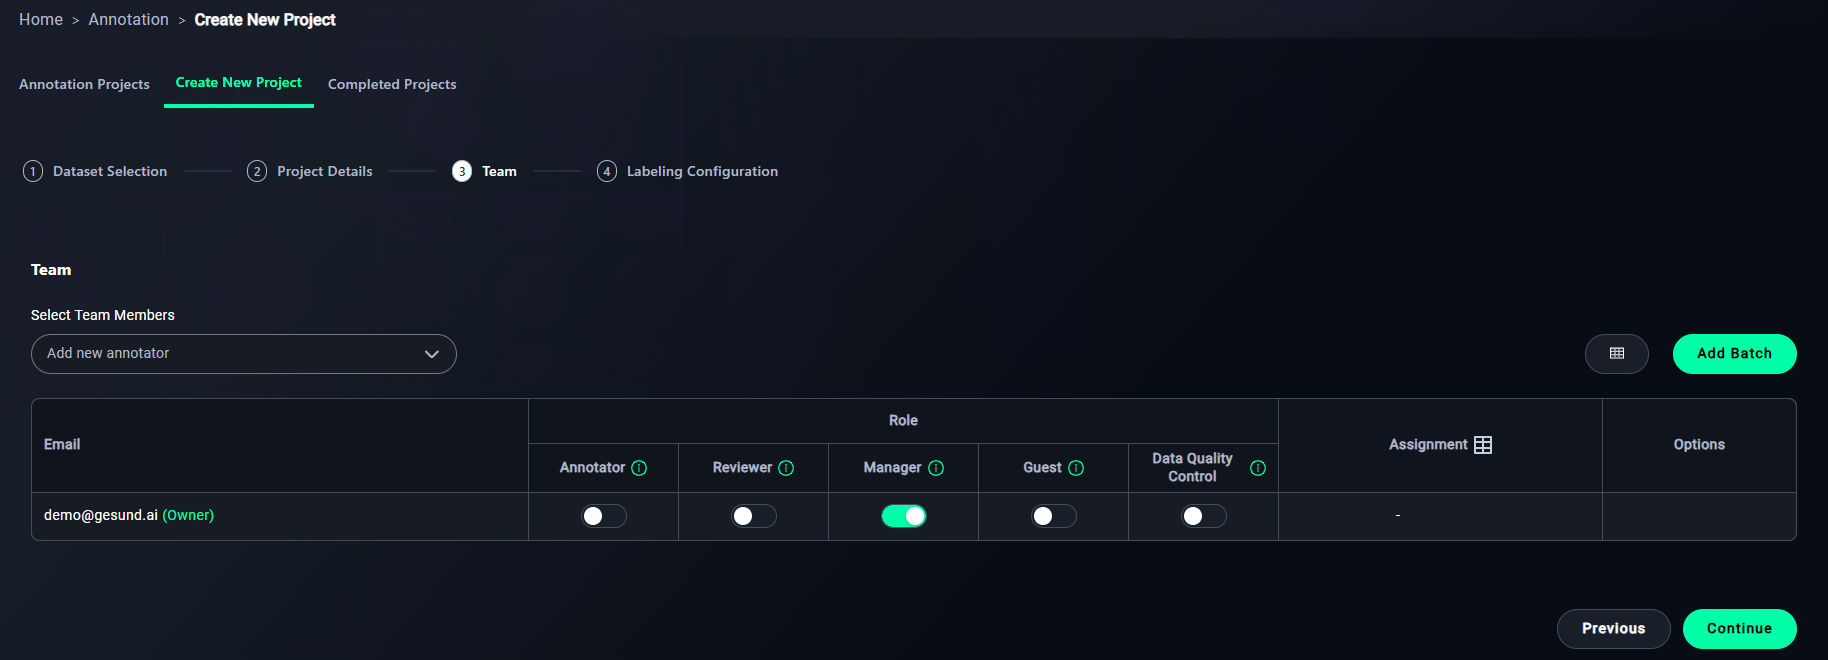
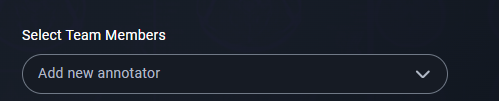
1. Add Annotators
- Add team members via email.
- Select a reader from the dropdown.
- You can see owner of the project at email column.
2. Assign Roles
- Assign roles to team members:
- Enable the features you want for the readers you want:
- Annotator: For labeling data.
- Reviewer: For reviewing annotations.
- Manager: For managing the project.
- Guest: For limited access.
- Data Quality Control: For overseeing annotation quality.
- Enable the features you want for the readers you want:

3. Set Assignments
- Assign datasets to team members.
- Click the assignment icon in the Annotator column to open the Assignment Modal.
4. Proceed
- Click Continue to move to Step 4: Labeling Configuration.
Assignment Modal
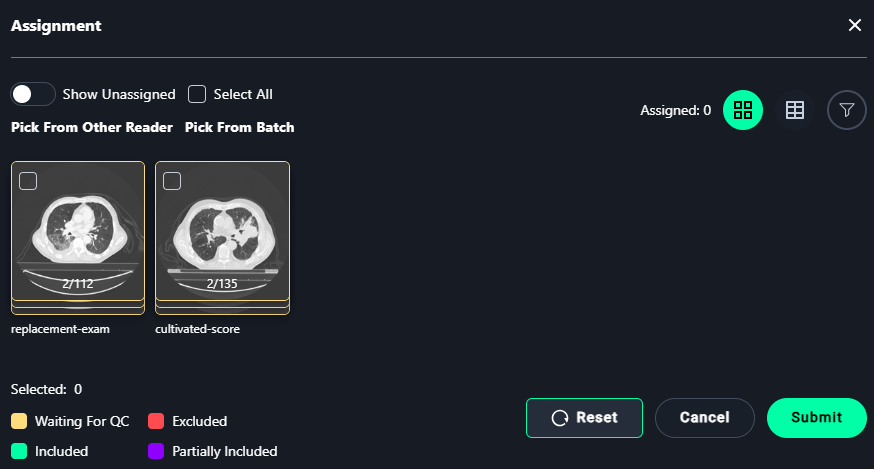
1. Select Images
- Assign images for annotation:
- Select individual images or use Select All to assign all visible images.
2. Finalize Assignments
- Click Submit to save the assignments.
- Use Reset to clear all selections.
Step 4: Labeling Configuration
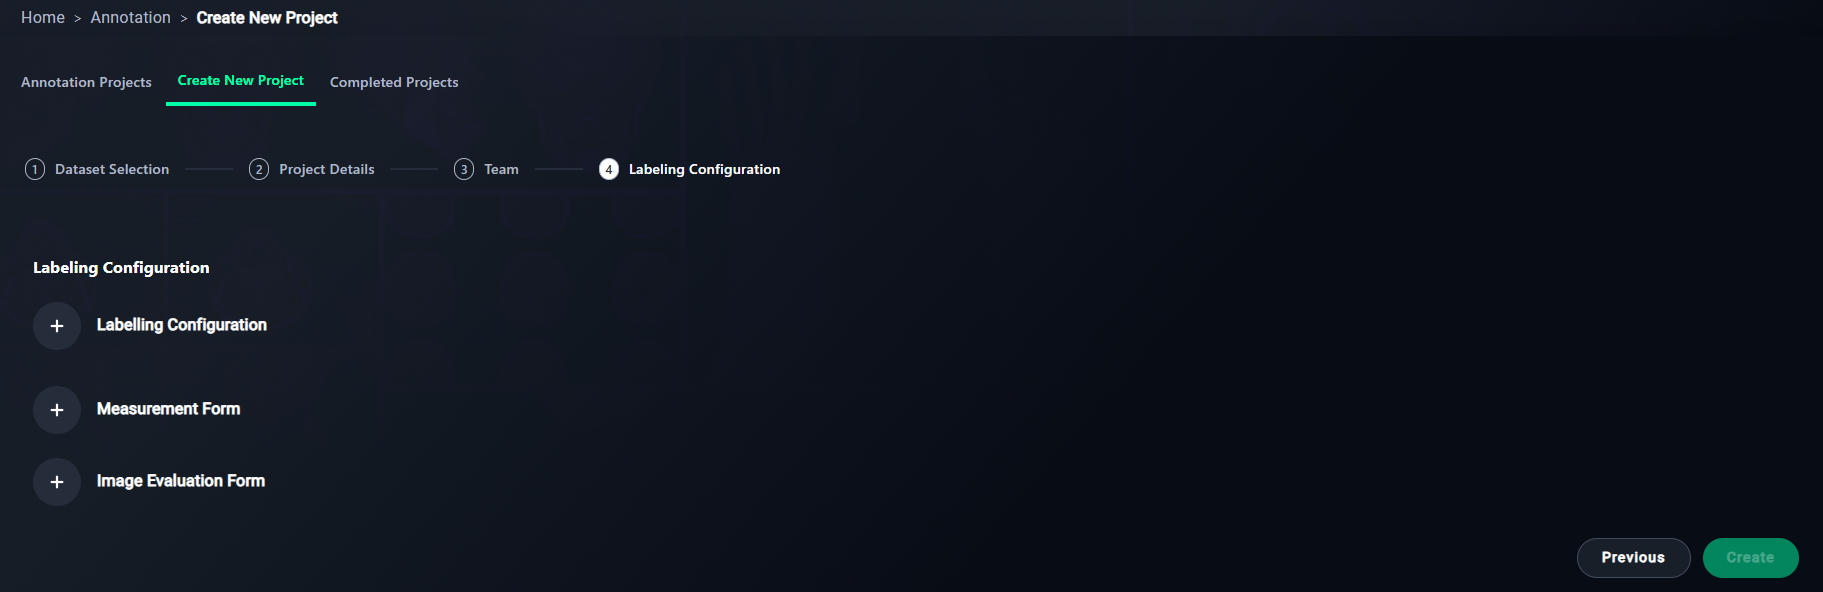
1. Add Labeling Configuration
- Set up labels for the project.
- Click + Labeling Configuration.
2. Optional: Add Measurement Form
- Define metrics for annotations.
- Click + Measurement Form.
3. Optional: Add Image Evaluation Form
- Add criteria for evaluating image quality.
- Click + Image Evaluation Form.
4. Finalize Configuration
- Click Create to save and finalize your project setup.
New Labeling Configuration Modal
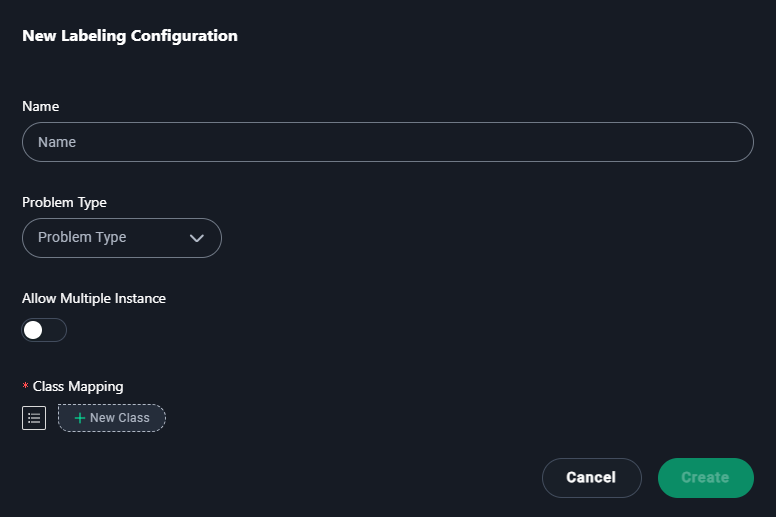
1. Name
- Enter a descriptive name for the labeling configuration.
- Type
Abdominopelvic CT Segmentation.
- Type

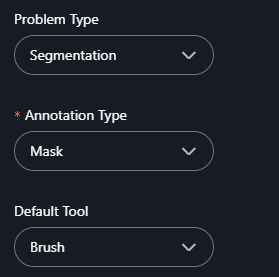
2. Problem Type
- Select the type of annotation problem:
- Classification
- Segmentation
- Semantic Segmentation
- Instance Segmentation
- Object Detection

3. Annotation Type (Segmentation is selected at example)
- If you select Segmentation as the problem type, choose an annotation type:
- Polygon: Use this for freehand or custom-shaped annotations.
- Mask: Use this for pixel-level annotations to label areas with high precision.

4. Default Tool (If Mask is Selected)
- If Mask is chosen as the annotation type, select a default tool:
- Brush: For painting regions manually with a brush-like tool.
- Freehand Scissors: For drawing freehand outlines to define regions.
- Correction Scissors: For modifying or correcting existing masks.
5. Allow Multiple Instances
- Enable this if multiple regions or instances of the same label can appear in the dataset.
4. Add Classes
- Add categories for annotations:
- Click + New Class and add
Esophagus, Neoplasm, Primary, Heart, Lung, Spinal cord.
- Click + New Class and add
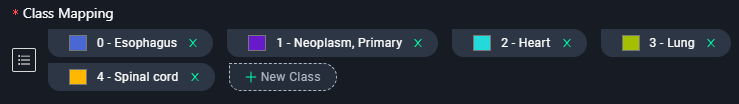
5. Save
- Click Create to save the configuration.
New Measurement Form Modal
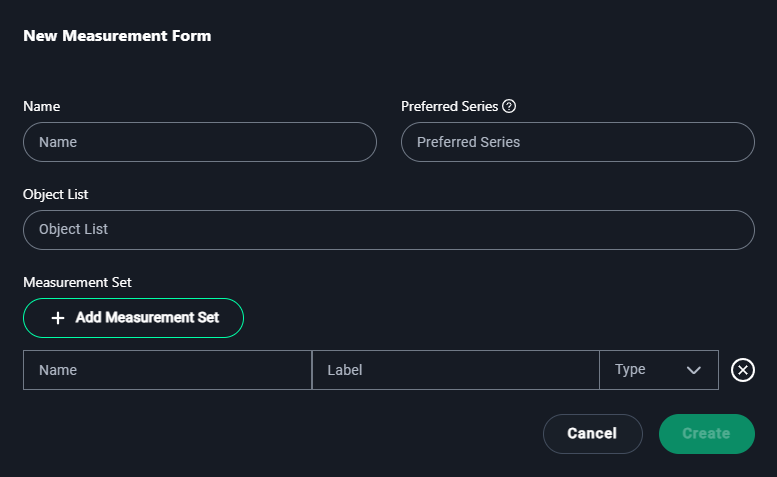
1. Name
- Enter a name for the measurement form that reflects its purpose.
Example:Lung Lesion Measurements

2. Preferred Series
- Specify the preferred dataset series if applicable.
Example:3D Lung Dataset

3. Object List
- Add objects for which measurements will be made.
Example:Lung Lesions, Tumors

4. Measurement Set
- Click + Add Measurement Set to define the types of measurements required:
- Name: Enter the name of the measurement.
- Example:
Lung Volume
- Example:
- Label: Provide a short label or abbreviation for the measurement.
- Example:
Vol
- Example:
- Type: Select the measurement type from the dropdown options:
- Length: For linear measurements.
- Polygon: For freehand shape measurements.
- Angle: For angular measurements.
- Cobb Angle: Specific for spine curvature.
- Mask: For segmented regions.
- Bidirectional: For width and height measurements.
- Rectangle: For bounding box measurements.
- Point: For single coordinate annotations.
- Name: Enter the name of the measurement.
5. Create
- Once the details are configured, click Create to save the measurement form.
New Image Evaluation Modal
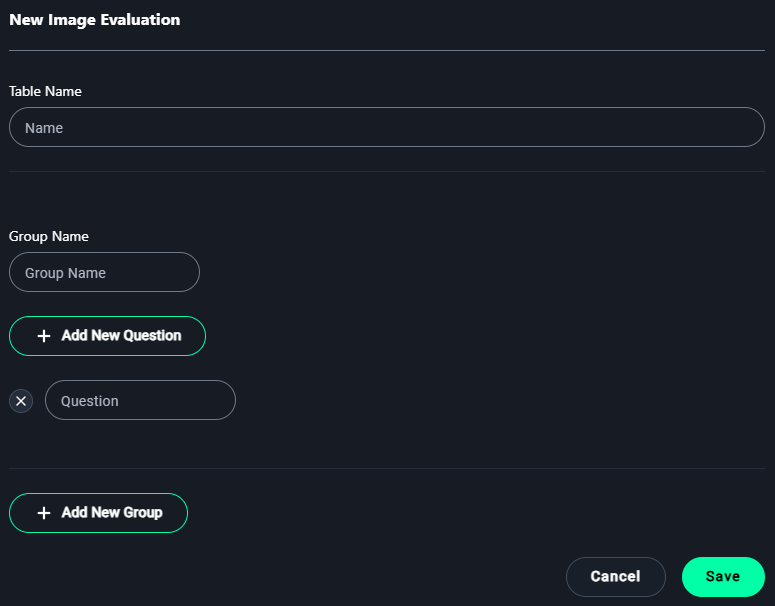
1. Table Name
- Enter a name for the evaluation table to describe its purpose.
Example:3D Lung Image Quality Evaluation

2. Group Name
- Add a group name to organize related evaluation questions.
Example:Image Clarity

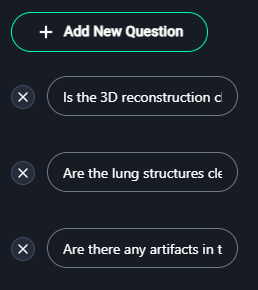
3. Add Questions
- Click + Add New Question to define criteria for evaluation.
Examples of questions:- "Is the 3D reconstruction clear and accurate?"
- "Are the lung structures clearly distinguishable?"
- "Are there any artifacts in the image?"
4. Add New Groups (Optional)
- Click + Add New Group to categorize questions further.
Example:- Group Name:
Lung Anatomy
Questions:- "Are the lung lobes clearly visible?"
- "Is the heart and surrounding anatomy properly segmented?"
- Group Name:
5. Save
- After adding all necessary groups and questions, click Save to finalize the image evaluation form.
Accessing Your Project
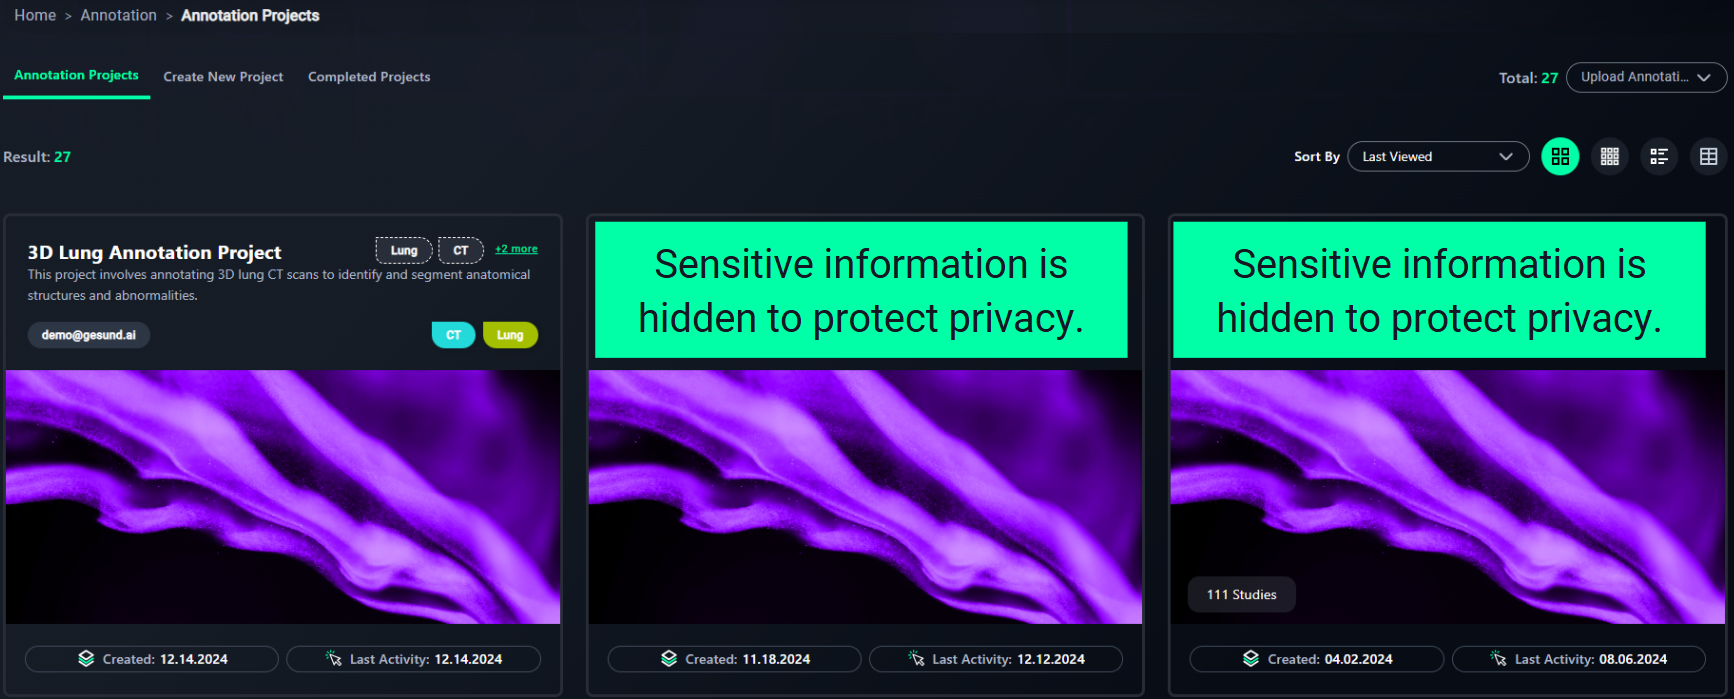
1. Locate Your Project
- The Annotation Projects dashboard displays all existing projects.
- Projects are shown as cards containing:
- Project Name: Describes the project's purpose (e.g., Chest X-Ray Annotation Project).
- Created Date: When the project was created.
- Last Activity: The most recent action performed.
2. Identify the Project Card
- Locate the card corresponding to your desired project.
Example: Look for "3D Lung Annotation Project"
3. Click on the Project Card
- Click the project card to open it and view detailed options, such as annotations, settings, or project statistics.
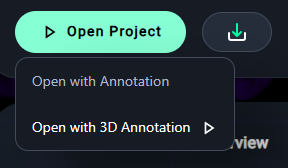
4. Open the Project
- Click Open Project and select your preferred annotation mode:
- Open with Annotation for 2D projects.
- Open with 3D Annotation for 3D-enabled datasets. (Click on this for example project)
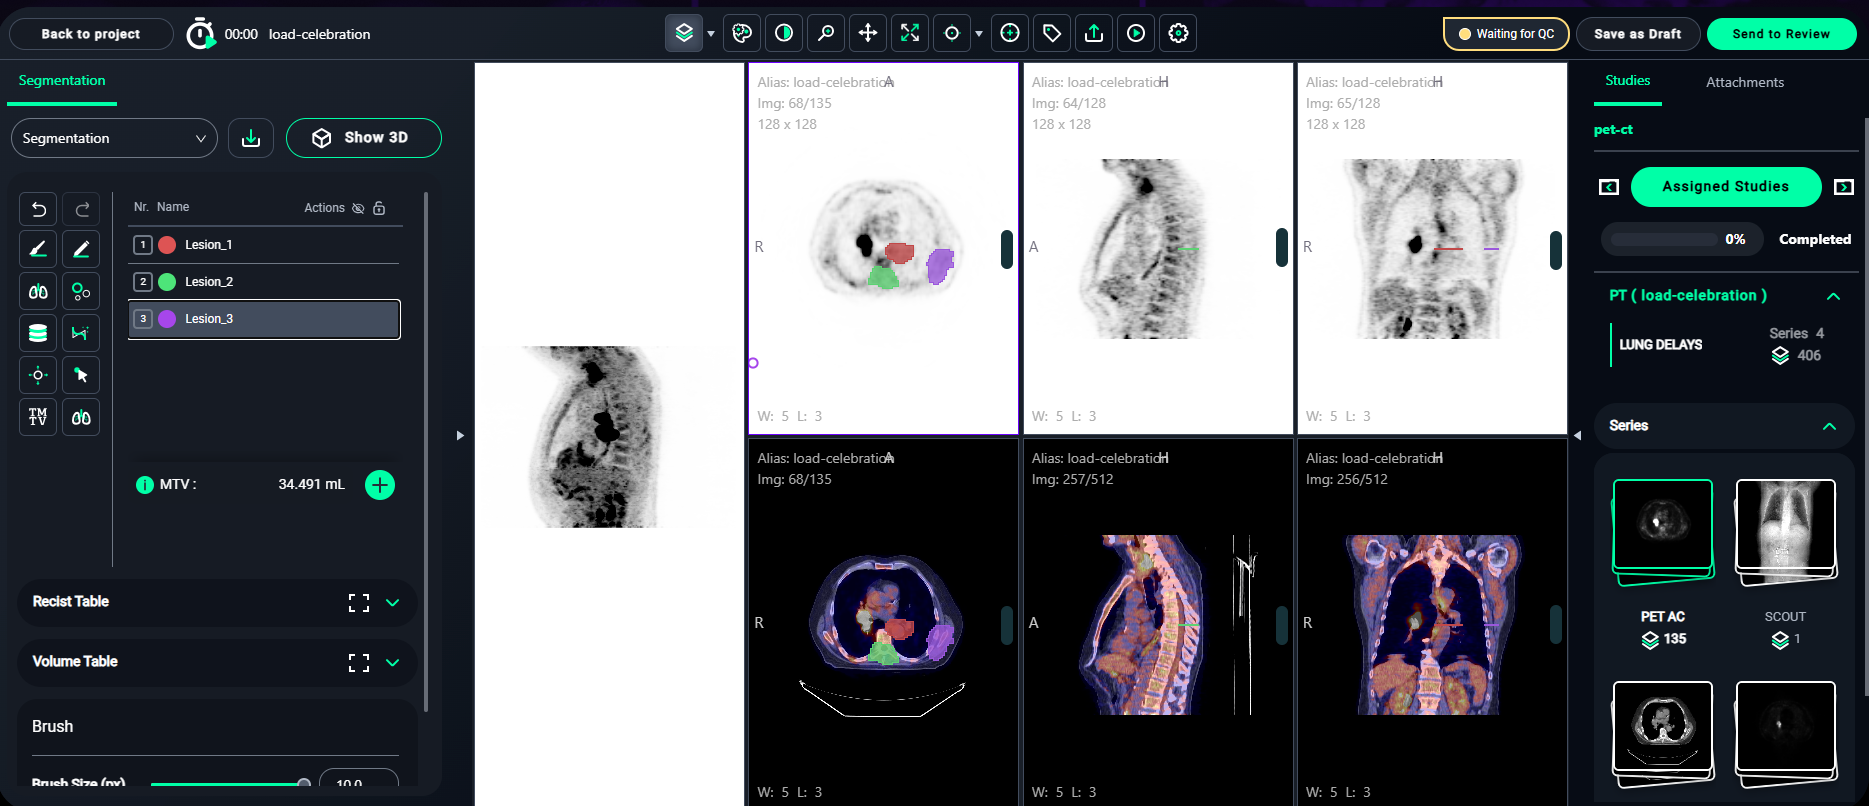
Annotation Viewer Page (3D)
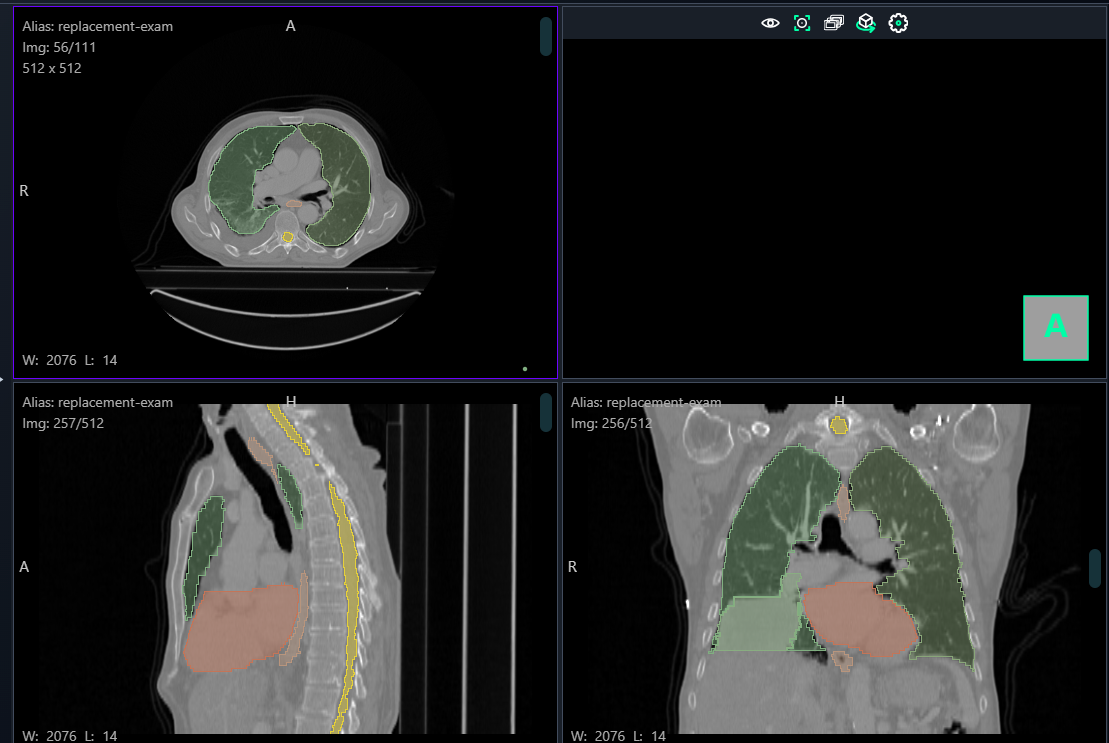
1. Navigating the Viewer
- The viewer displays multiple views of the CT scan:
- Axial View (Top Left): Horizontal cross-section of the body.
- Sagittal View (Bottom Left): Side view showing the body from left to right.
- Coronal View (Bottom Right): Frontal view of the body.
- 3D Preview (Top Right): Displays a volumetric view of the segmentation.
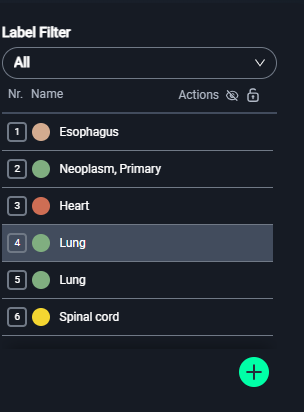
2. Selecting a Label
- Go to the Label Filter panel on the left.
- Choose the appropriate label for your segmentation:
- Esophagus: Brown
- Neoplasm, Primary: Red
- Heart: Pink
- Lung: Green
- Spinal Cord: Yellow
- To add a new label, click the green + button, name the label, and assign a color.
- Choose the appropriate label for your segmentation:
3. Annotating Regions
Step 1: Select the Tool
From the toolbar on the left, you can choose various segmentation tools. Each tool is designed for a specific purpose, allowing precision and flexibility in creating annotations. Here's an explanation of each tool:
Toolbar Tools (Left Panel)
-
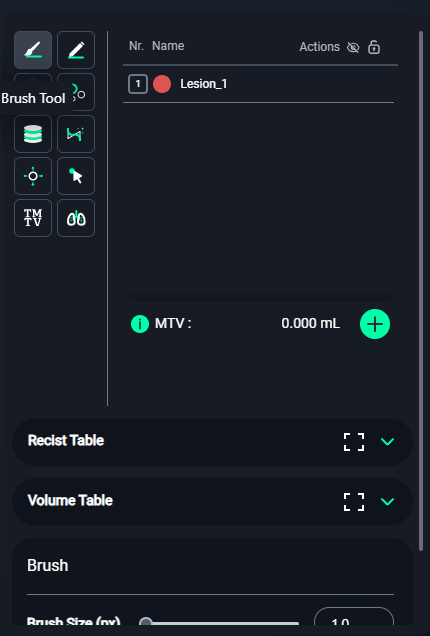
Brush Tool (This tool selected at example project)
- Use this tool to manually paint regions of interest.
- Adjustable settings include brush size for detailed control.
-
Freehand Segmentation Tool
- Ideal for drawing irregular or custom-shaped annotations.
-
GrowCut Tool
- Automatically segments regions based on initial seeds or markings.
-
Islands Tool
- Isolates and selects segmented regions for targeted edits.
-
Fill Between Slices Tool
- Automatically connects annotations across adjacent slices for consistency.
-
Smoothing Tool
- Refines jagged edges in segmented regions for clean and professional results.
-
Region Growing Tool
- Expands selected areas based on intensity or similarity criteria.
-
Click-to-Segment Tool
- Enables precise segmentation by clicking on the desired region.
-
TotalSeg Tool
- Performs automated segmentation of pre-defined structures or categories.
Each tool enhances your workflow, depending on the complexity and requirements of the task at hand.

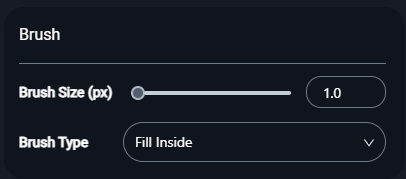
Step 2: Adjust Settings
- Customize the brush settings for precise annotations:
-
Brush Size (px):
- Use the slider to adjust the brush size in pixels.
- Smaller sizes are ideal for detailed regions, while larger sizes work for broader areas.
-
Brush Type:
- Select the brush type from the dropdown menu to match your annotation needs:
- Fill Inside: Fills the region within the boundaries.
- Erase Inside: Removes annotation within selected boundaries.
- Fill Sphere: Annotates spherical regions.
- Erase Sphere: Erases spherical regions.
- Threshold: Automatically detects edges based on intensity thresholds for segmentation.
- Threshold Eraser: Removes annotations within specific intensity thresholds.
- Select the brush type from the dropdown menu to match your annotation needs:
Step 3: Perform Annotation
- Axial View: Start by identifying the region in this view and drawing the segmentation.
- Sagittal and Coronal Views: Validate and refine the segmentation across slices to ensure consistency.
- 3D View: Toggle the Show 3D button to review the segmentation in a volumetric model and check for alignment.
4. Saving and Submitting
- After completing the segmentation:
- Click Save as Draft to save your progress without submission.
- Click Send to Review to submit the annotated study for quality control.
- Pro Tip: Ensure all slices in the axial, sagittal, and coronal views are consistently segmented before submission.

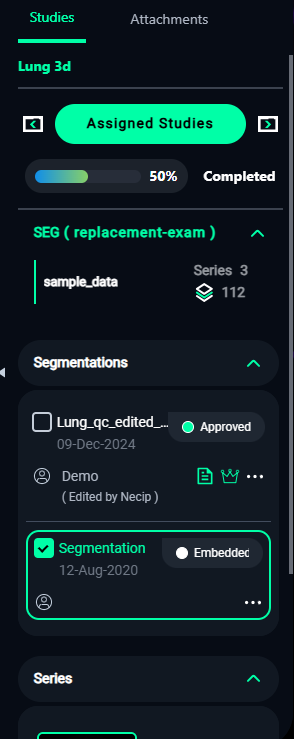
5. Assigned Studies
- Monitor your progress in the Assigned Studies panel on the right:
- Completed Percentage: Shows how much of the assigned work is finished.
- Segmentations: Lists all completed segmentations for the current study.
- Approval Status: Displays whether the segmentation has been reviewed or approved.
6. Toolbar Functions Overview
Top Toolbar
- Window Level: Adjust the window width and level to enhance image contrast and brightness.
- Pan: Move the image within the viewport to focus on specific regions.
- Zoom: Magnify or reduce the size of the image for detailed inspection or broader context.
- Rotate: Rotate the image around its axes to view the segmentation from different perspectives.
- Roll: Roll the image for more precise adjustments of orientation.
- Cropbox: Define a cropped area to focus only on the region of interest.
- Volume Config: Access and modify the settings for the volumetric display, such as transparency or coloring.
- Settings: Open the configuration panel to adjust general or advanced settings related to the viewer.

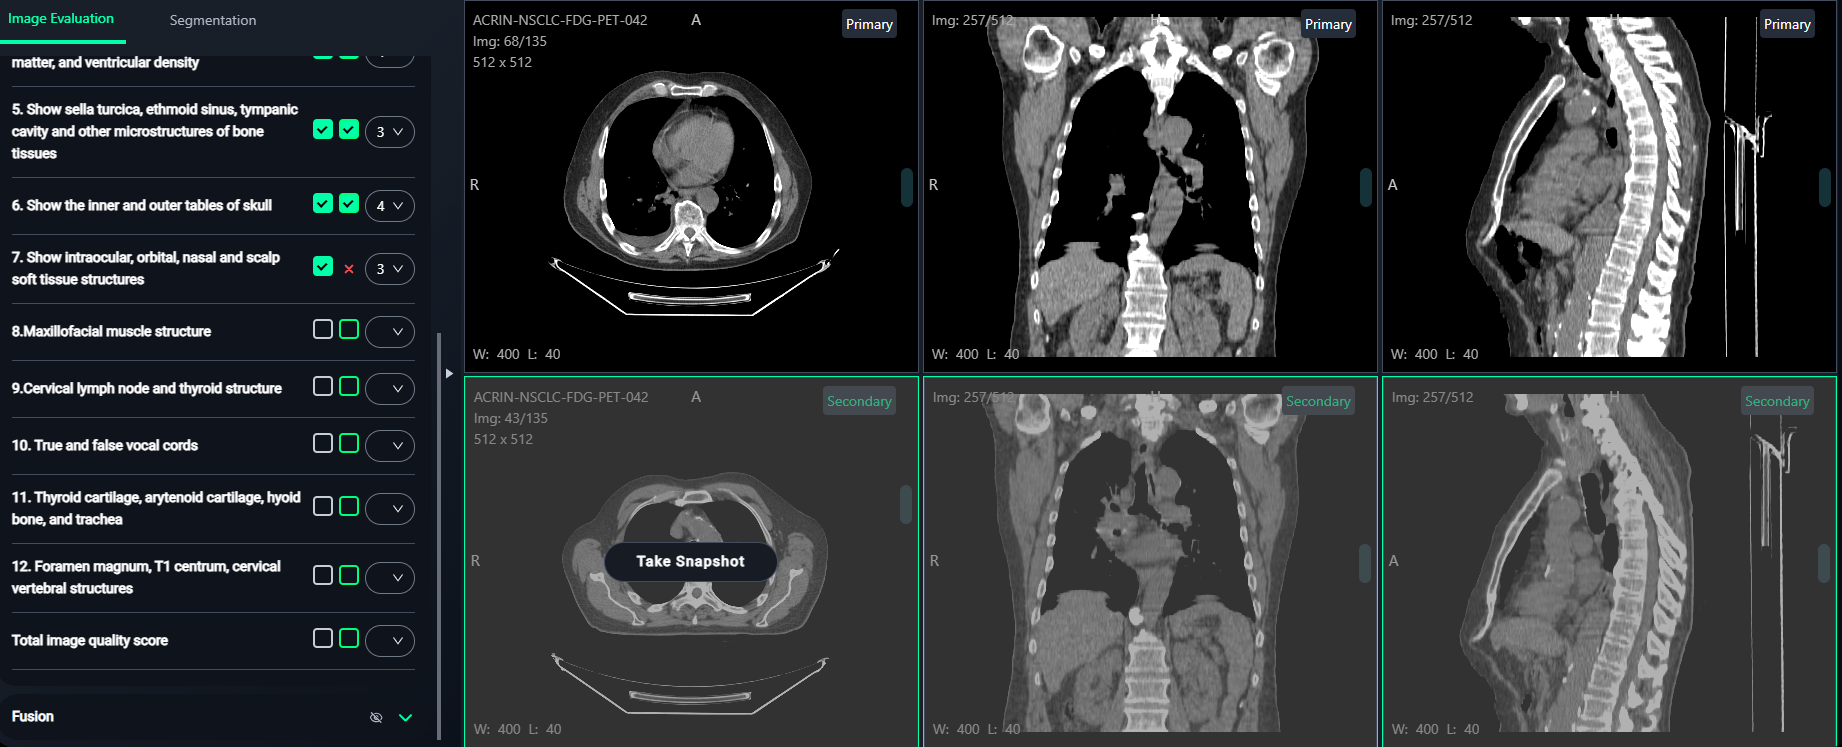
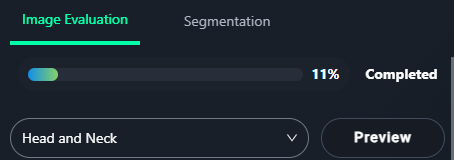
7. Image Evaluation Workflow
The Image Evaluation section allows annotators to evaluate images based on criteria and compare before-and-after snapshots.
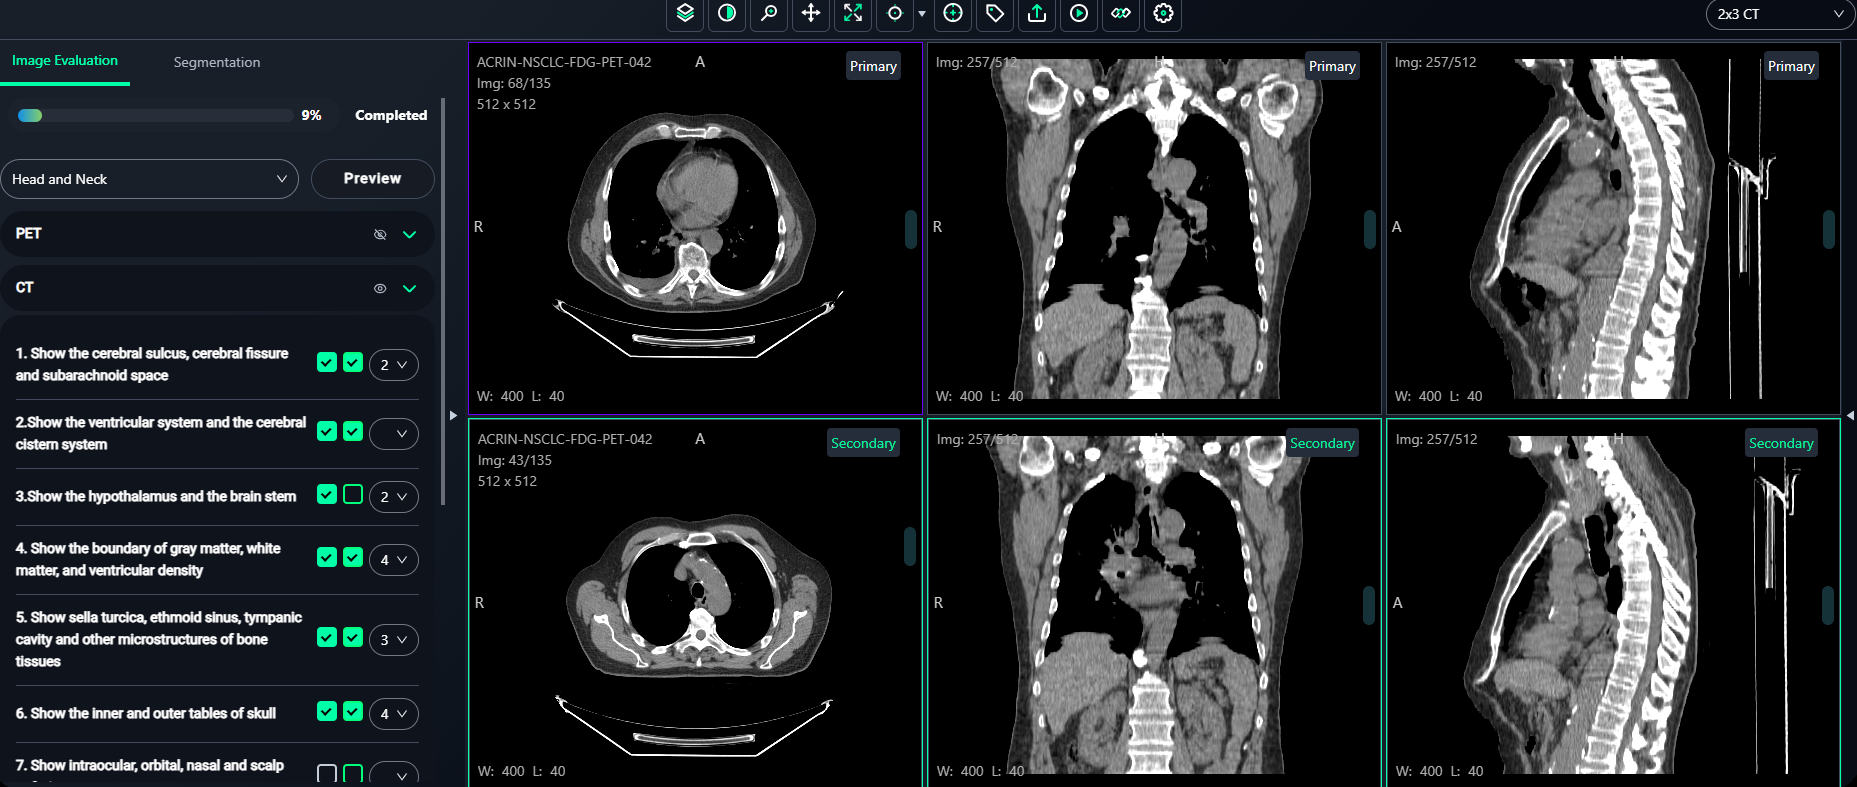
Steps to Evaluate Images
-
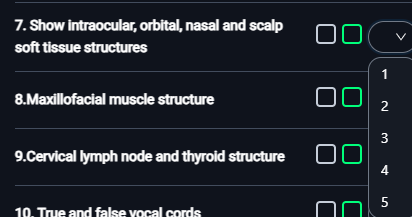
Select the Score
- For each evaluation criterion on the left panel, use the dropdown to assign a Score (e.g., 1–5).
-
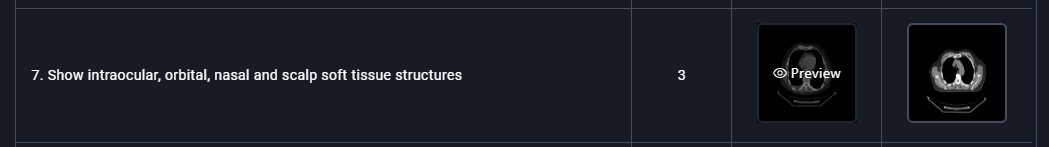
Select the Images and Take Snapshots
- Left Box: Click the left checkbox to select any image from the top 3 views (Primary images).
- Hover over the desired image and click "Take Snapshot".
- A confirmation message like "Snapshot is saved successfully" will appear at the top-right corner.
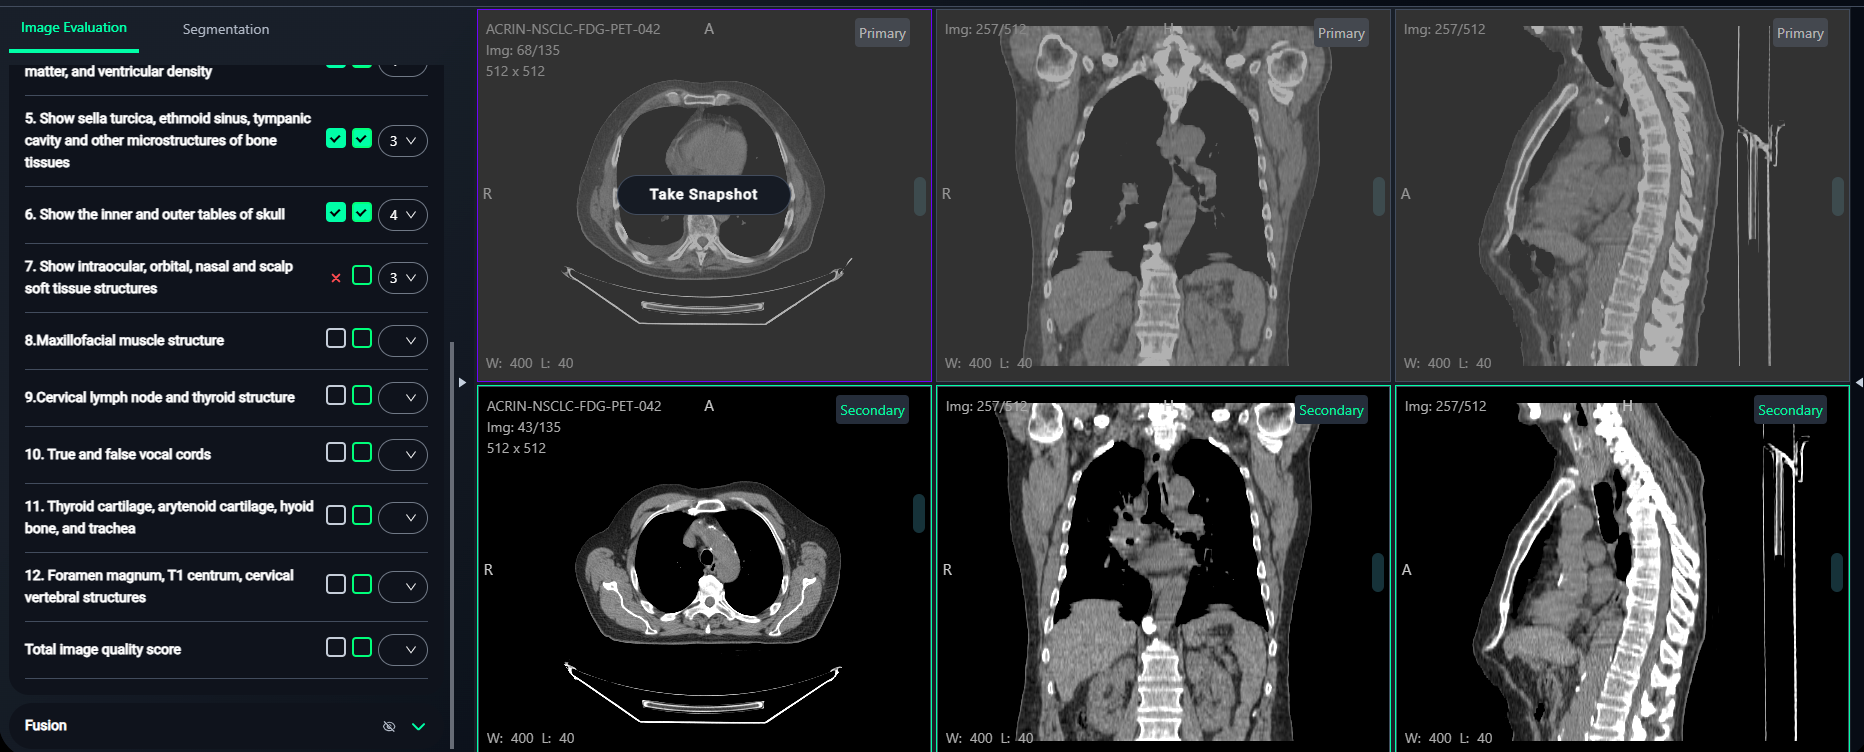
- Right Box: Click the right checkbox to select any image from the bottom 3 views (Secondary images).
- Hover over the desired image and click "Take Snapshot".
- A confirmation message like "Snapshot is saved successfully." will appear at the top-right corner.
-
Preview Snapshots
- Click the Preview button at the top of the Image Evaluation panel to view saved snapshots.
- Progress can be tracked via the Completion Bar at the top of the panel.
- Inside the Preview window:
- Click on any snapshot to preview it.
8. PET-CT Segmentation Workflow
For PET-CT datasets, the segmentation process involves lesion identification and volume calculations.
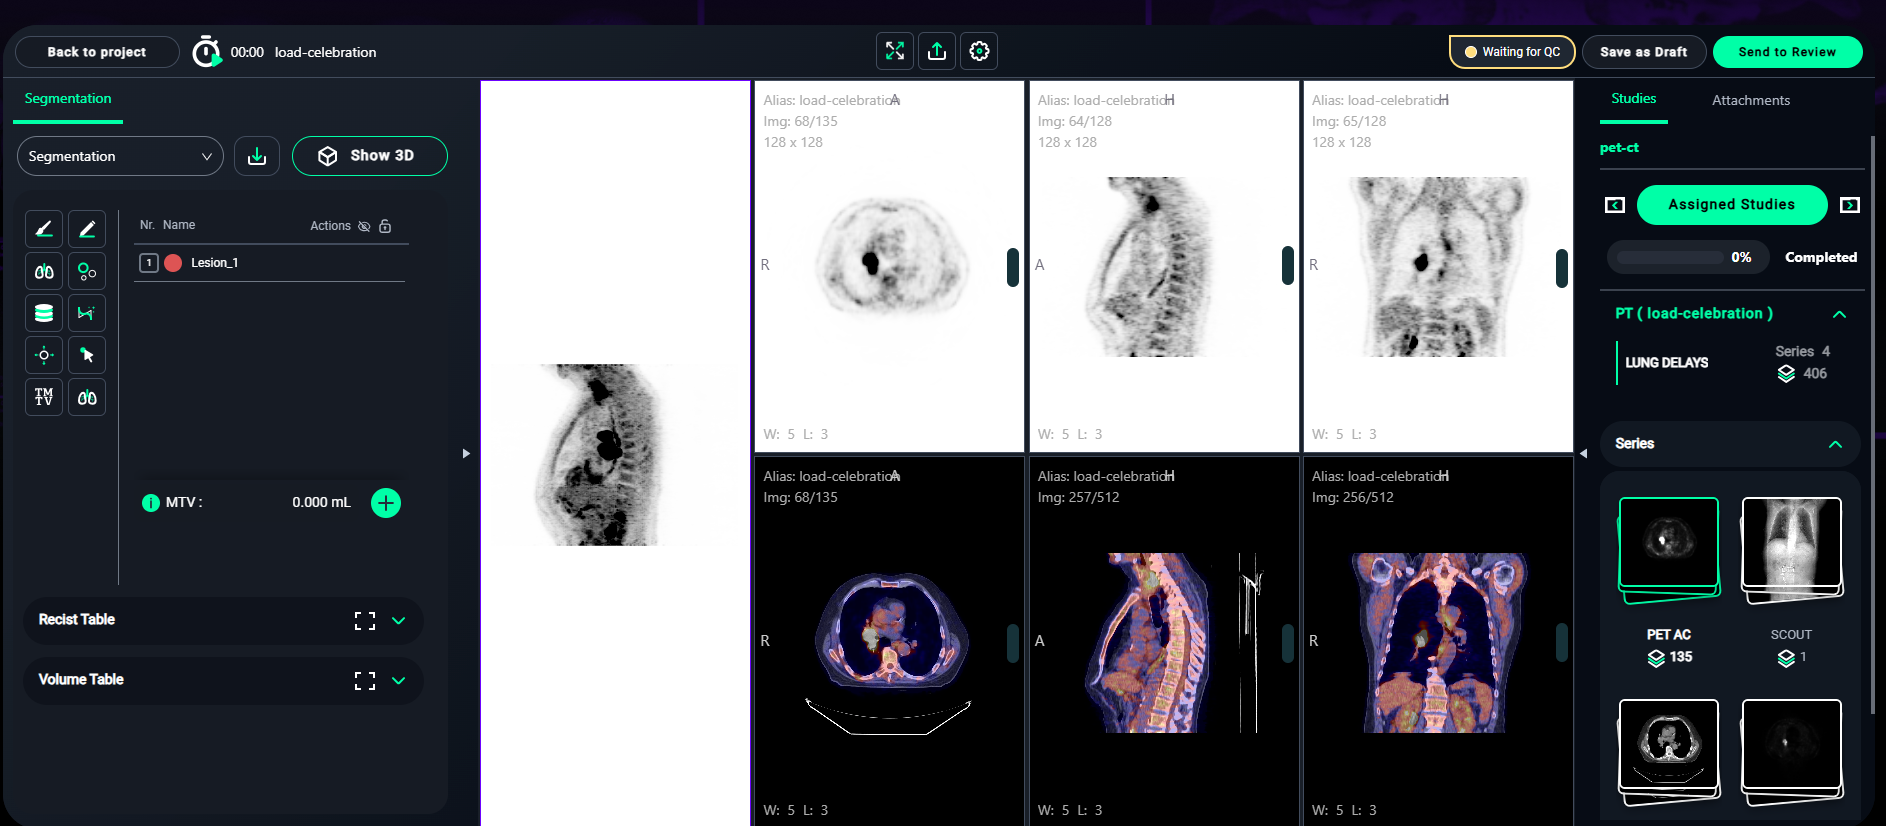
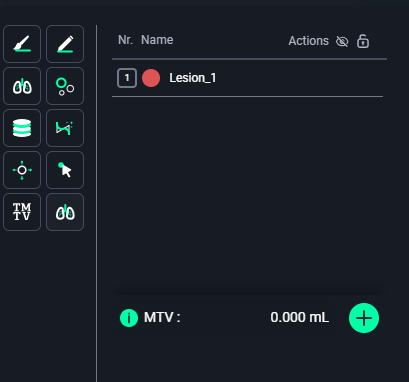
1. Segmentation Setup
- In the Segmentation panel on the left:
- Click the + Add Lesion button to start a new segmentation.
- Name the lesion appropriately (e.g., Lesion_1, Lesion_2).
- Choose a color for easy identification.
2. Annotating Lesions
-
Step 1: Select the Annotation Tool
- Choose the Brush Tool for precise manual annotation.
-
Step 2: Annotate the Lesions
- Identify lesions in the Axial, Coronal, and Sagittal views.
- Paint over the lesion regions carefully in each slice.
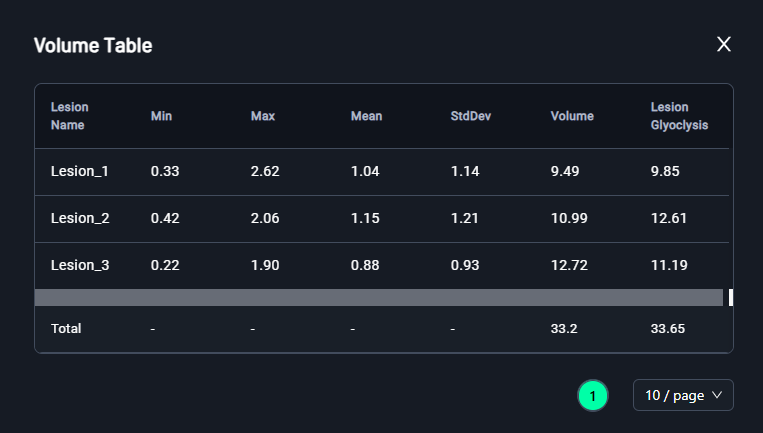
3. Volume Table
-
After segmenting the lesions:
- Navigate to the Volume Table section (bottom-left).
- Review the lesion details, including:
- Min: Minimum pixel value.
- Max: Maximum pixel value.
- Mean: Average intensity.
- StdDev: Standard deviation.
- Volume: Total volume of the lesion.
- Lesion Glycolysis: Calculated glycolysis value.
- The Total Volume and Lesion Glycolysis will be summarized at the bottom.
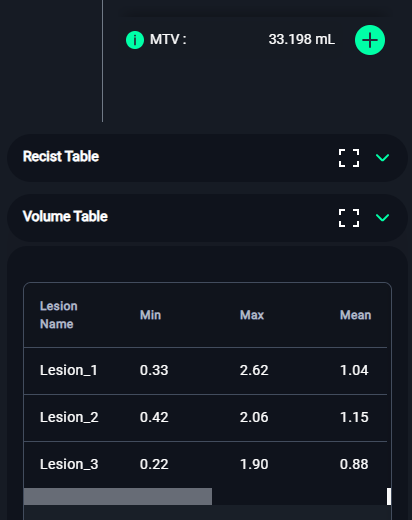
. Click on the icon to expand the Volume Table.
4. Submitting PET-CT Segmentation
- After annotating and reviewing the lesions:
- Click Save as Draft to save your progress.
- Click Send to Review to submit the segmentation for quality control.